Users find out before IT does
The first notification is a help desk ticket. By then the impact has already started and the clock is running against you.

 JD Edwards EnterpriseOne
NovaCon AlwaysOn continuously monitors your JD Edwards estate, spots the early signs of degradation, opens one numbered ticket per incident, and turns operational data into context your team can act on, before a stalled job becomes an outage.
Agentless by design: nothing is installed on your JD Edwards servers.
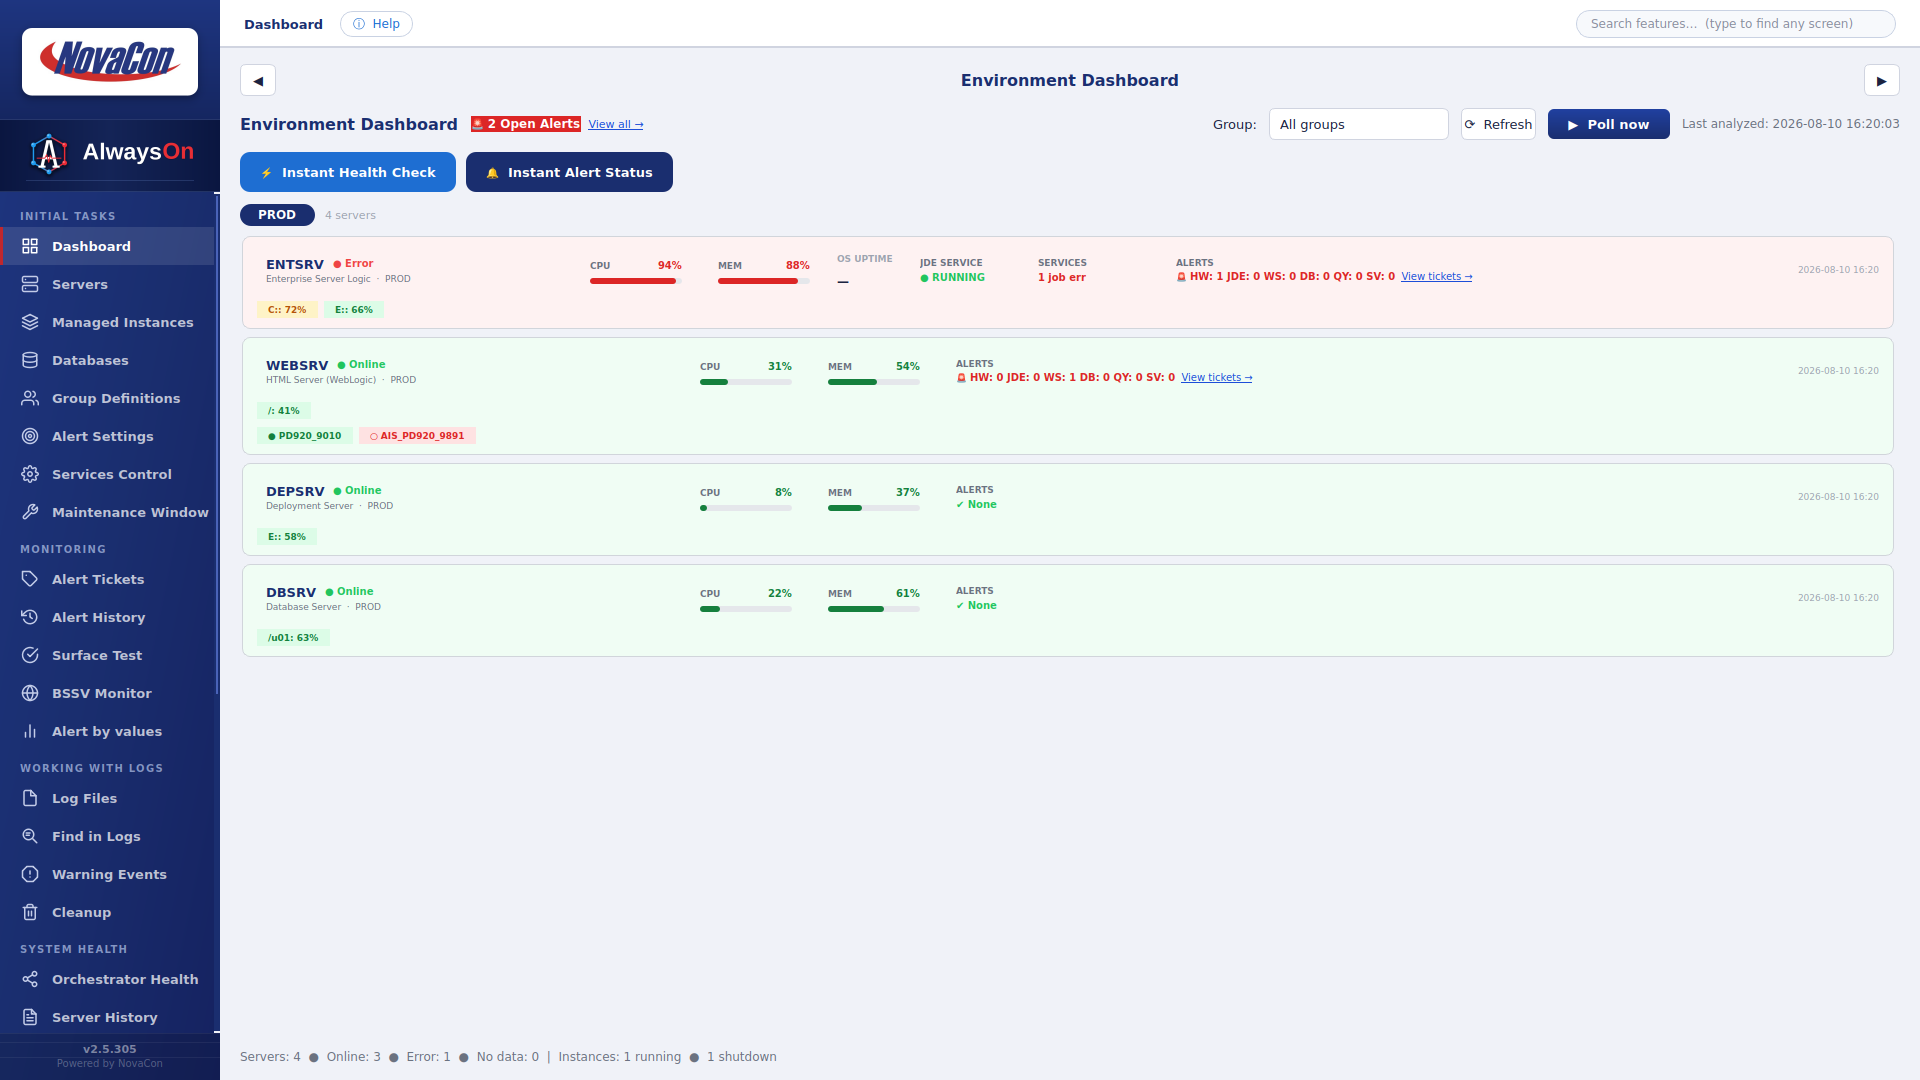 ENTSRV · CPU 94% over threshold
JDE service RUNNING
ENTSRV · CPU 94% over threshold
JDE service RUNNING
Before a problem turns into downtime there are almost always symptoms: a job that never finishes, a process that keeps growing, a service that degrades, a blocker in the database, a disk closing in on its limit, or an instance that stops answering the way it should. The question is whether anyone sees them in time.
The first notification is a help desk ticket. By then the impact has already started and the clock is running against you.
Oracle, Enterprise Server, WebLogic, AIS, batch queues and logs each end up investigated in a different console, by a different person.
Diagnosis depends on the handful of specialists who know exactly where to look, and that knowledge rarely survives a vacation or a resignation.
The problem gets fixed, but with no recorded history the pattern behind it stays invisible. So it comes back.
Outside business hours, finding cause and context can mean logging into several environments and consoles before the real work even begins.
Knowing that CPU is high or that a port is open is not the same as understanding what that means for jdenet kernels, a UBE queue or an AIS instance.
The goal is not to generate more alarms. It is to shorten the gap between “something is wrong” and “we know where to look and what to do.”
Agentless collectors connect over SSH, WMI/WinRM, REST and database connections, continuously and across every tier.
51 alert types evaluated against thresholds set per group and category, with sustained-duration rules that ignore spikes.
One numbered ticket per incident, reused until it resolves, carrying the measured value, the threshold and the full evaluation history.
Guarded operational actions such as cleanup, service control and scheduled commands, with start, stop and restart always waiting for human approval.
AlwaysOn continuously monitors infrastructure components, JD Edwards services, middleware and databases, centralizing status, alerts, history and operational actions in a single experience, across roughly 45 screens organized the way the work actually happens.
Continuous visibility into hosts, JD Edwards services, WebLogic managed instances and databases: Linux over SSH, Windows over WMI and WinRM, IBM i through DB2 for i SQL Services.
Alerts with context, carrying auto-numbered tickets, per-group thresholds, sustained-duration rules, cooldowns, snooze, maintenance windows, full history and automatic resolution.
Guarded log and runtime-cache cleanup, scheduled OS commands, service control and one-click database lock resolution. Repetitive work handled safely, and always confirmed.
A generic monitor tells you the host is answering. AlwaysOn tells you the batch engine went down, that jdenet kernels are missing, that the Scheduler stopped firing, or that an AIS instance is refusing connections on 9891, in the vocabulary your CNC team already uses.
ORA-00600 found in jde.logThe JDE ticket family covers 10 alert types dedicated to Enterprise Server services alone.
“Is the Scheduler actually firing?” gets answered on one screen, not by reading a log on the Enterprise Server.
Monitoring queries are read-only by default. Any write action is explicit, gated and recorded.
Read through the WebLogic and Server Manager REST APIs, with no agent deployed to the web tier.
The hardware family alone accounts for 11 of the 51 alert types.
Alerting on everything is not better monitoring. It is how a team learns to ignore its own monitor. Every AlwaysOn alert clears the same seven steps before it reaches a human.
Is this alert type enabled for that server's group and category? Configuration lives on the group, never on each server.
The measured value is compared against the threshold for that group and category, shipped with sensible factory defaults.
Where it applies, the condition has to hold for N continuous minutes. A single false reading resets the streak, so a spike never pages anyone.
Snooze, pause rules, deployment windows and maintenance windows stop the alert before it opens a ticket or sends mail.
After sending, the same alert stays quiet for a set time. The ticket stays open: you are not told twice about the same problem.
A dedup key identifies the incident and reuses its number, so one problem keeps one history instead of scattering across your inbox.
When the condition clears, the ticket closes on its own and a green RESOLVED email goes out.
Alert History keeps every evaluation: the value, the threshold, the result, and the cooldown that held the alert back.
51 alert types across 9 ticket families. The ticket prefix tells you at a glance whose problem it is.
Every screen below is the real product, version 2.5.305. These are not mockups.
Status, CPU, memory, disk per mount point, operating system uptime, JDE service state and open alerts by family, for every server in the group, refreshed continuously.
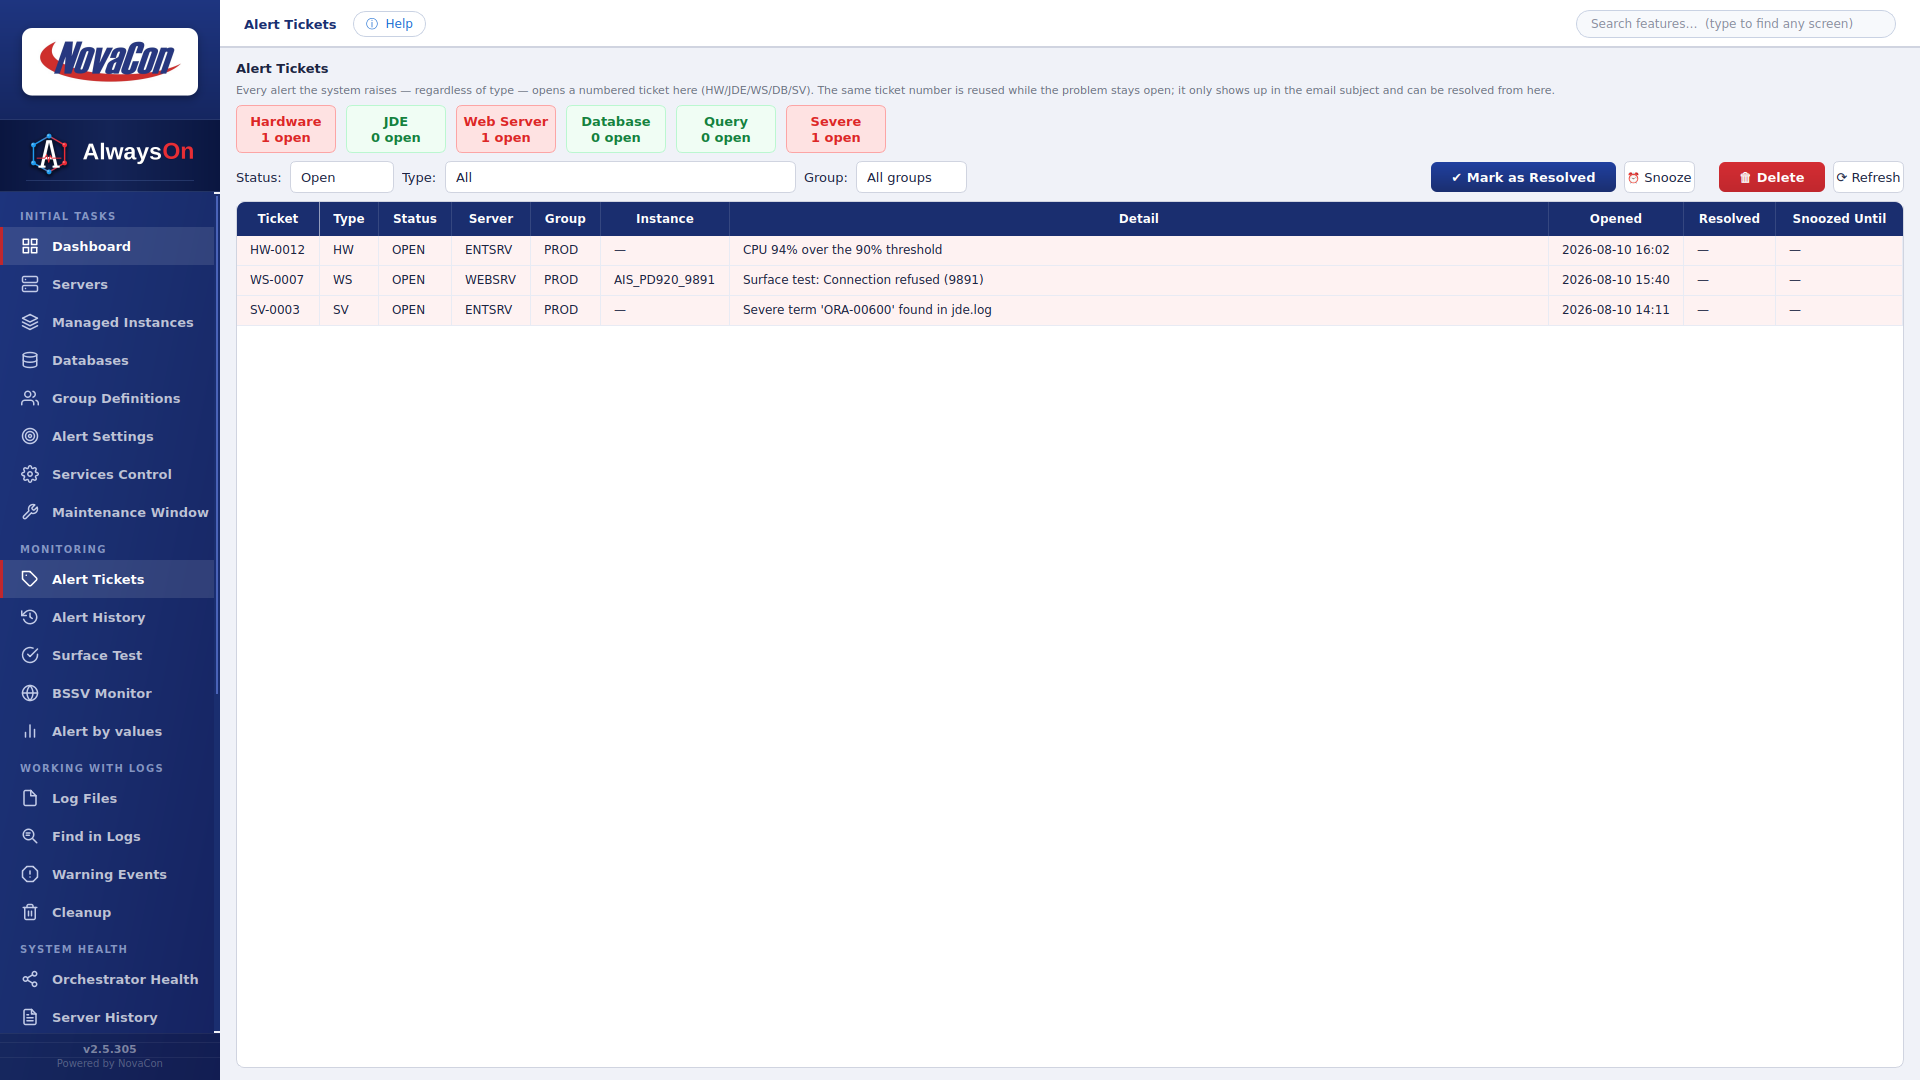
Every alert the system raises opens a numbered ticket. The same number is reused while the problem stays open, so an incident keeps a single identity from first signal to resolution.
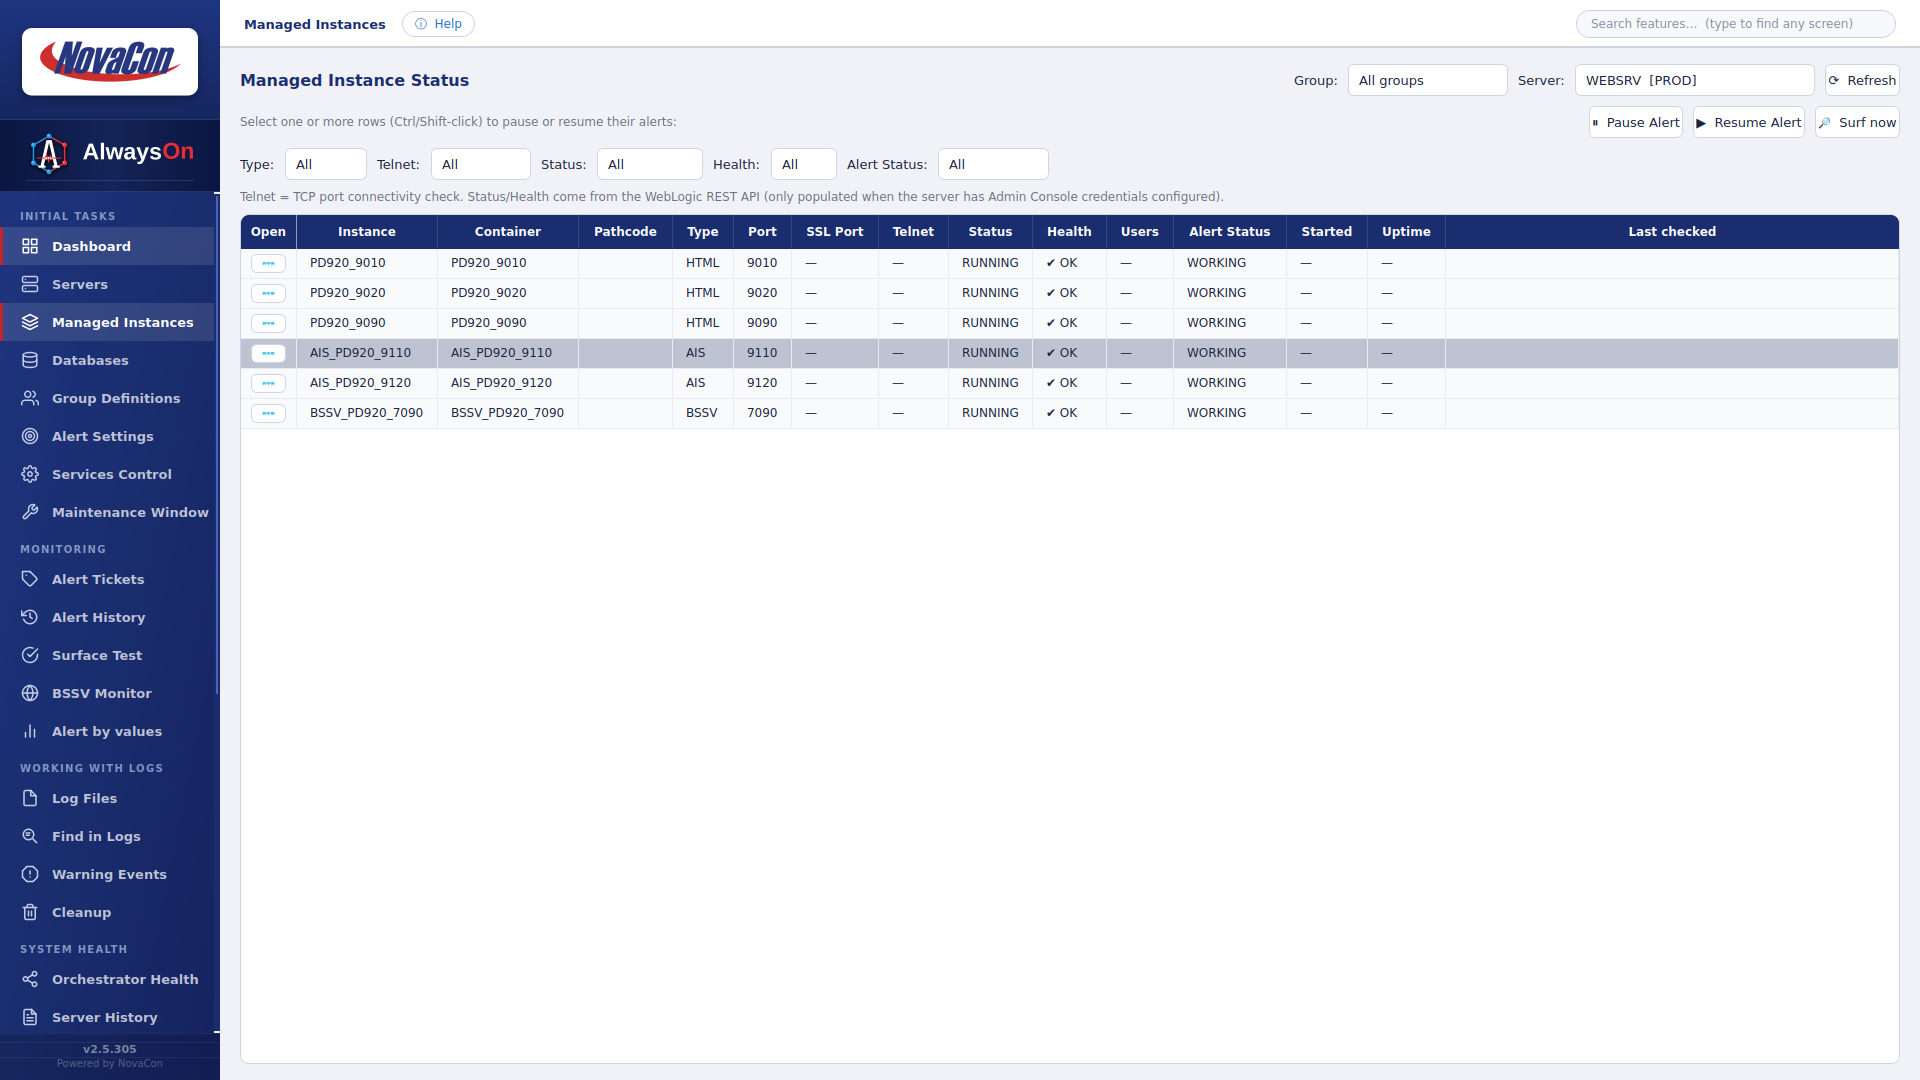
State, health, ports and active users for each managed instance, read through the WebLogic and Server Manager REST APIs, with nothing installed on the web tier.
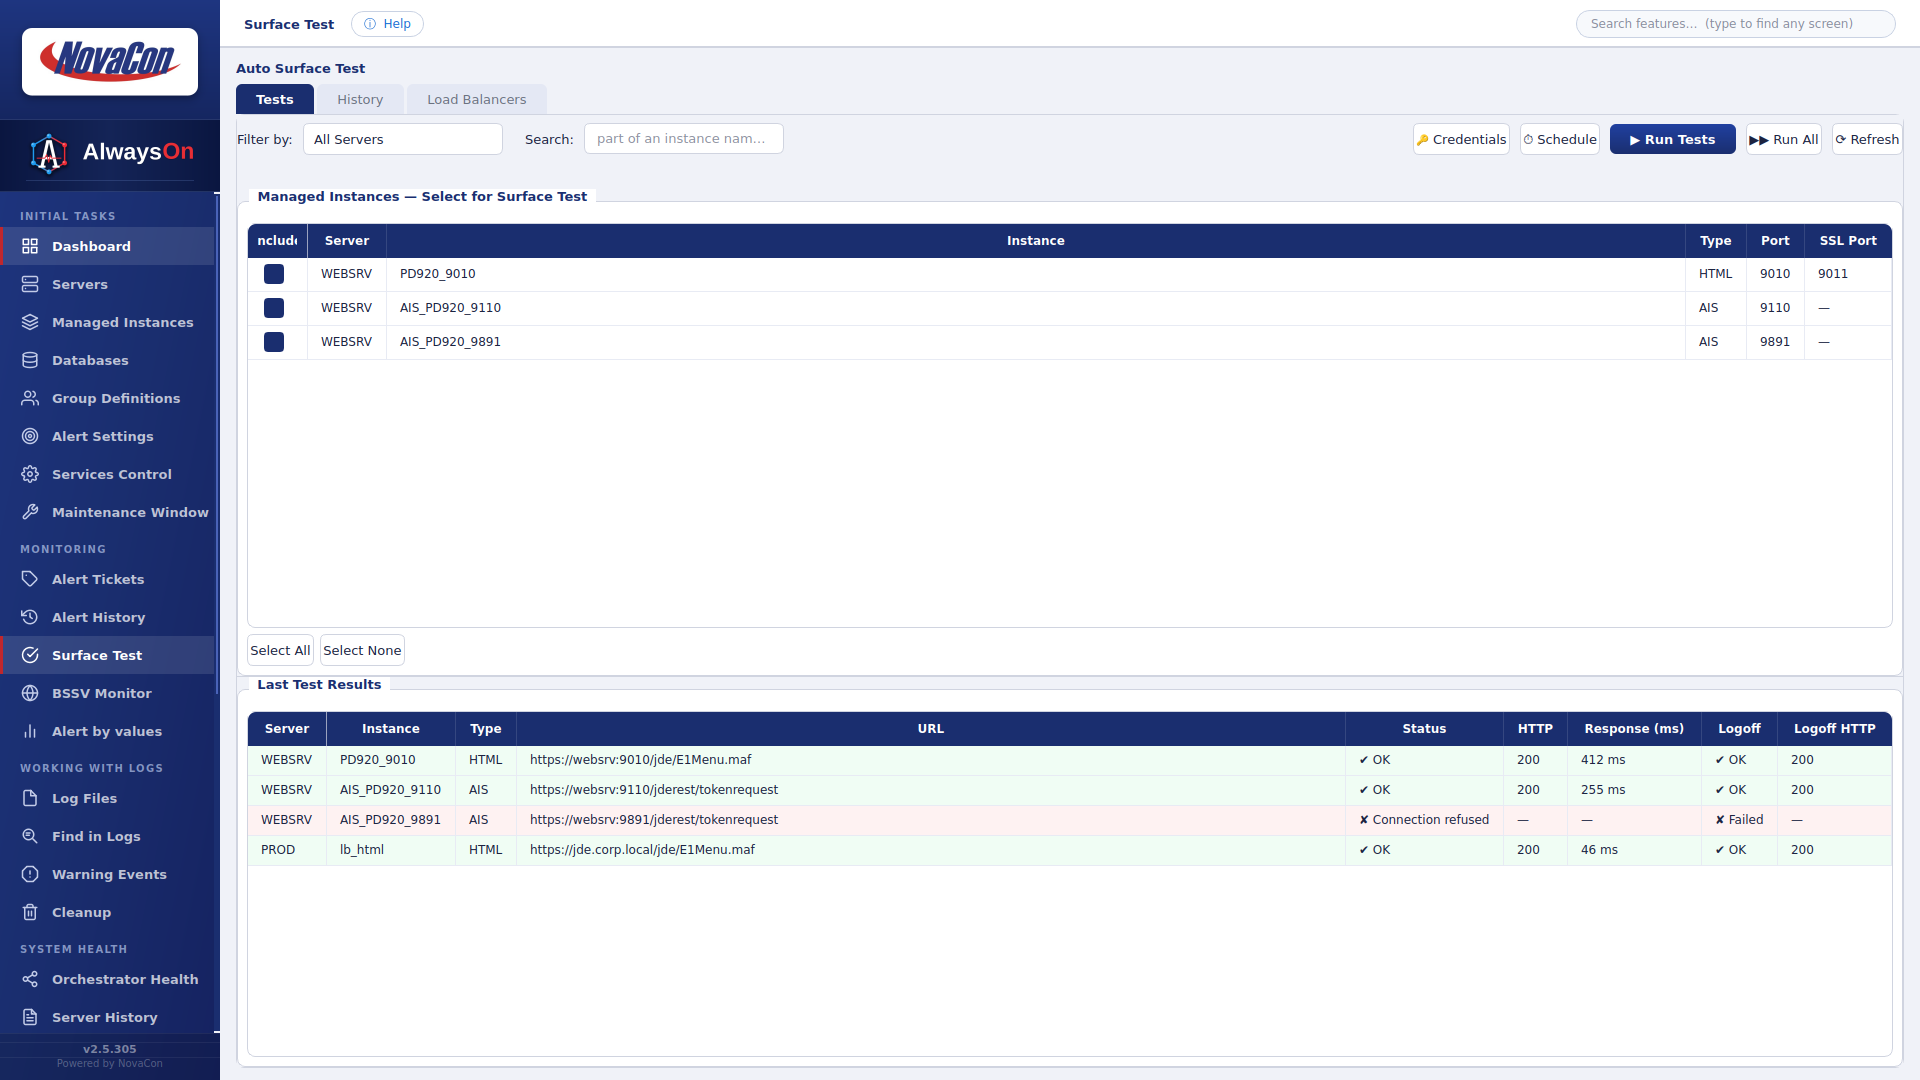
Scheduled JD Edwards login tests per managed instance, covering HTML, AIS and BSSV, measuring not only whether the endpoint answers but how long the login takes.
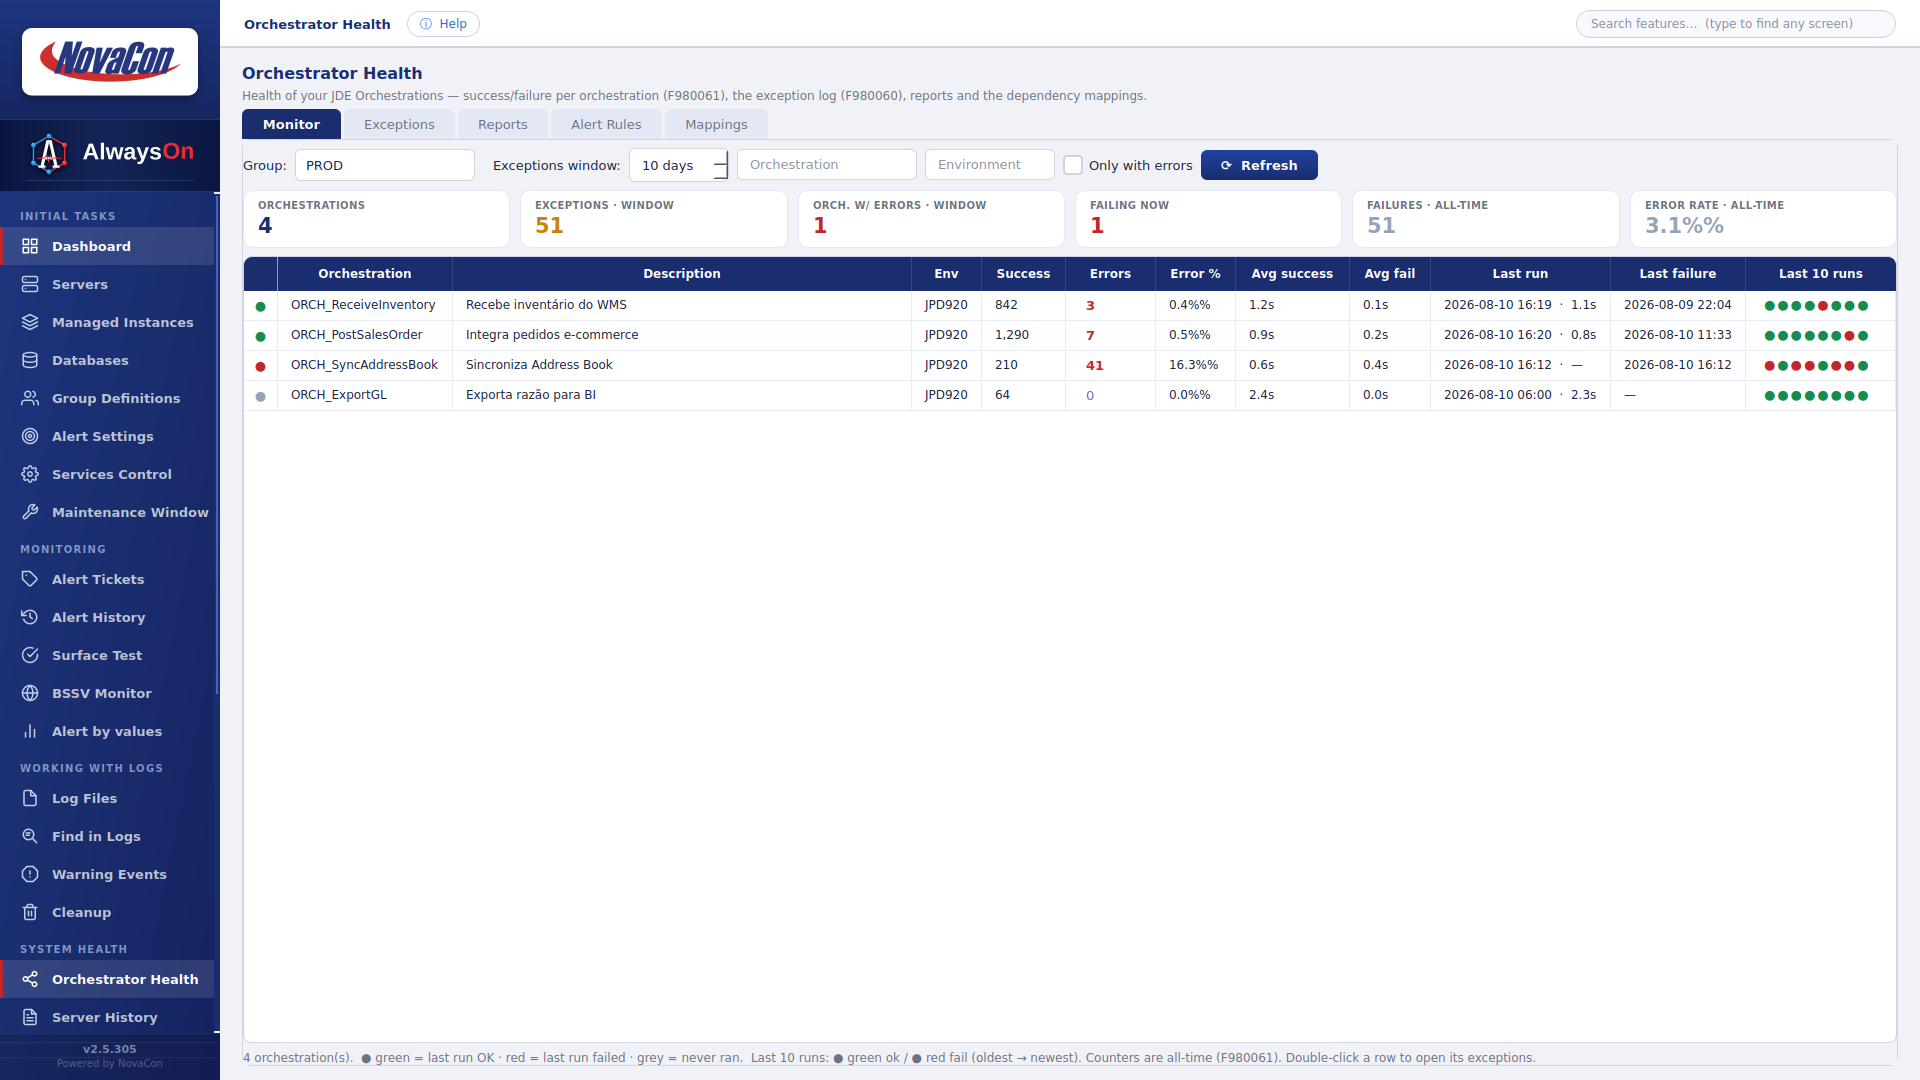
Is the JDE Scheduler firing? Which orchestrations are failing, and how long do they take? Both questions get a screen instead of an investigation.
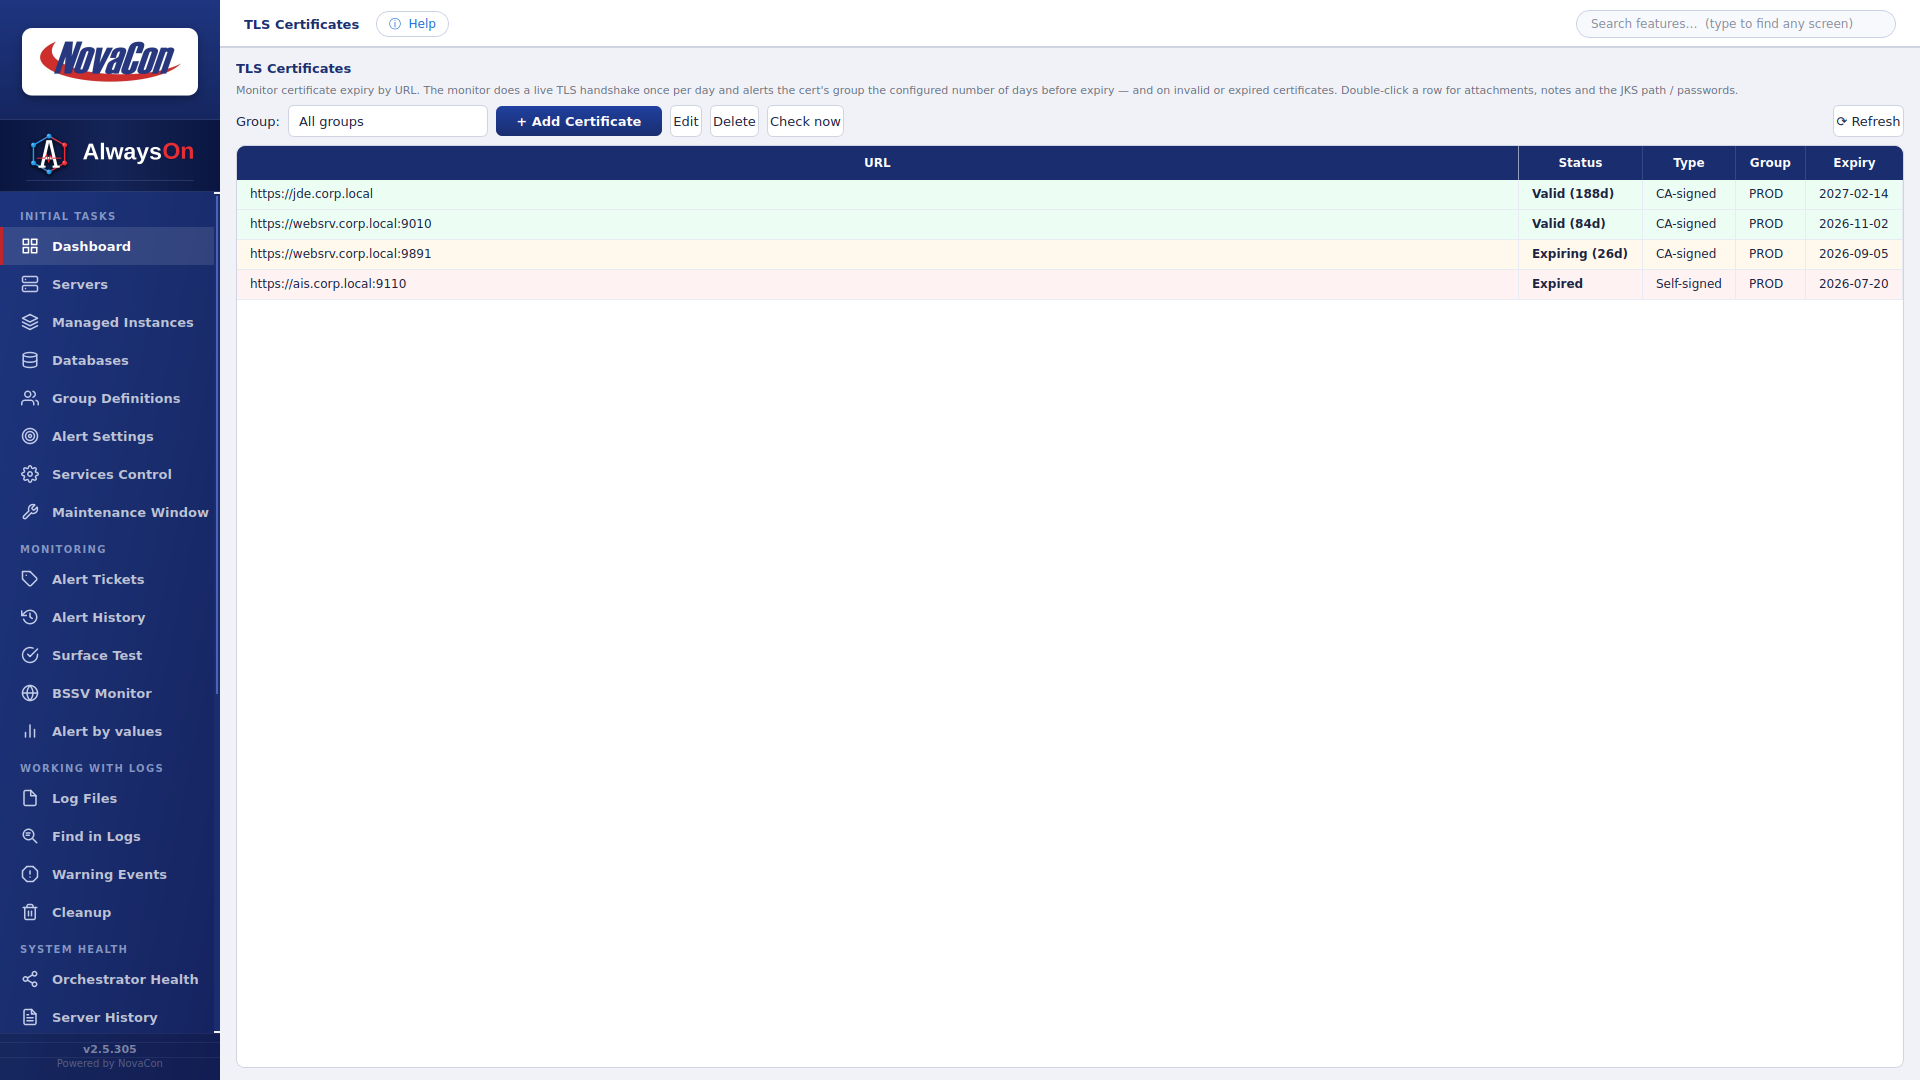
Every monitored endpoint is checked daily and alerts well ahead of expiry. It is the class of outage that is entirely preventable and still happens on a Sunday.
Automation does not mean giving up control. Sensitive actions stay explicit, bounded and auditable, which is exactly why they can be trusted to run at all.
Log and runtime-cache cleanup per server, per group, or after a reboot. Find lists every runtime-cache job with its real size so you can clear selectively, with every path validated and a strong confirmation.
Operating system commands over SSH or PowerShell, scheduled and run from one place instead of from six terminal sessions.
Start and stop managed instances and Enterprise Server services, guarded and confirmed before anything happens.
Blockers in red, waiters in yellow. Resolve one specific session, or every blocker, in a single click, from the same screen that showed you the problem.
If an auto-kill reports success and the process is still alive on the next cycle, the product says so instead of trusting its own result.
Cleanup validates every path before acting and is structurally prevented from removing the product. That is the guard rail that makes everything else safe.
AlwaysOn is deliberately built in three levels of authority. You can stay on the first one indefinitely, and plenty of teams do. The levels above it only ever act inside the limits you set.
See it before anyone reports it.
Get to the diagnosis faster.
Automation with controlled authority.
No percentages here. Those numbers depend on your environment, not on our marketing. What follows is the change in how the work actually gets done.
This calculator does arithmetic on the numbers you type. It describes your current reactive operation. It is not a NovaCon projection, promise or claimed saving. Change any field to model your own scenario.
A monitoring tool holds credentials for every tier of your ERP. That makes how it stores, uses and records them a primary design constraint, not a checklist item.
The local database is an encrypted SQLCipher (AES) store, unreadable without the key.
Every operating system, database, service, admin and keystore password is encrypted, never stored in clear text.
Database monitoring queries are read-only by default. Write actions are explicit and gated.
Cleanup validates every path and requires a strong confirmation, and it can never delete the product itself.
A read-only trail of every configuration change and every write issued against a registered database, with the command and where it came from. Credential access and every alert state are logged.
A mandatory application password hashed with Argon2, optional TOTP two-factor with replay protection, email OTP login with rate limiting, and a machine token plus a time-limited human session guarding every request.
SSH and TLS host keys are pinned on first use, so impersonation of a monitored host is detected rather than trusted.
The desktop backend binds to 127.0.0.1. Browser access is a separate, opt-in HTTPS console on its own port, off by default, with credentials redacted server-side before any response leaves the machine.
JD Edwards sign-on history from F9312 and per-connection database user auditing, with rules that flag (or, in Final mode, deactivate) users dormant for too long, behind a protected list and a percentage fuse.
AlwaysOn reaches out, reads, and reports. No agent is installed on your JD Edwards servers, and nothing runs where it shouldn't.
Architecture as documented for AlwaysOn v2.5.305.
AlwaysOn comes out of the daily practice of a consultancy dedicated exclusively to operating, modernizing and protecting JD Edwards environments. Every alert in it exists because somebody needed it at 3 a.m.
A consultancy dedicated only to JD Edwards CNC, with no conflicts of interest and depth instead of breadth.
Certified specialists working alongside your internal IT across every JD Edwards supported platform, with a long-term partnership mindset.
AlwaysOn is a monitoring, alerting and automation product built specifically for Oracle JD Edwards EnterpriseOne environments. It runs as a desktop client plus an always-on Windows Service, continuously collects data from infrastructure, JD Edwards services, WebLogic managed instances and databases, and centralizes status, alerts, history and guarded operational actions across roughly 45 screens.
It is designed to cover what generic infrastructure monitoring cannot reach: the JD Edwards layer. A general-purpose monitor reports that CPU is high or that a port is open. AlwaysOn evaluates jdenet kernels, the batch engine, UBE queues, the JDE Scheduler, JAS, AIS and BSSV managed instances, Oracle blockers and tablespaces, and real JD Edwards logins, and it also covers CPU, memory, disk per mount point and reachability at the host level. Whether it replaces or complements your current tool depends on your estate, which is exactly the kind of question an assessment answers.
Enterprise Server services, with jdenet kernels, the batch engine, JDE ports, the security server, zombie and runaway processes; batch and UBE, with jobs in error, jobs waiting, the JDE Scheduler and Job Monitor history; the web tier, with WebLogic and WebSphere managed instances, JAS, AIS and BSSV, surface tests and web exceptions; Oracle, SQL Server and DB2 for i databases; the Orchestrator; TLS certificates; and the underlying hosts. In total, 51 alert types across 9 ticket families.
No. AlwaysOn is agentless by design. It connects outbound to collect: SSH for Linux hosts, WMI and WinRM for Windows, the WebLogic and Server Manager REST APIs for the web tier, and standard database connections for Oracle and SQL Server. Enterprise servers on IBM i are read through DB2 for i SQL Services. Nothing is installed on your JD Edwards servers and nothing is left behind.
AlwaysOn runs inside your network and reaches your JD Edwards estate over SSH, WMI/WinRM, REST and database connections. Wherever those connections are allowed, whether on-premises, in cloud-hosted environments, or a mix of both, the collectors work the same way. Network paths and firewall rules are part of what an assessment maps out for your specific topology.
Through seven sequential steps. The alert type has to be enabled for that server's group and category; the measured value has to cross a threshold set per group; where it applies, the condition has to hold for N continuous minutes, so a single false reading resets the streak; snooze, pause rules, deployment and maintenance windows suppress it during planned events; a cooldown keeps the same alert quiet after sending while the ticket stays open; a dedup key reuses the existing ticket number; and when the condition clears, the ticket resolves automatically with a green RESOLVED email. Every evaluation is recorded either way, including the cooldown that held one back.
The local database is an encrypted SQLCipher (AES) store, unreadable without the key. Every operating system, database, service, admin and keystore password is encrypted and never stored in clear text. Access requires a mandatory application password hashed with Argon2, with optional TOTP two-factor or email OTP, and every request is guarded by a machine token plus a time-limited human session. SSH and TLS host keys are pinned on first use. Credentials are redacted server-side before any response leaves the machine, and credential access is logged.
Yes, and it is explicit. Database monitoring queries are read-only by default; write actions are gated. Cleanup validates every path, requires a strong confirmation, and is structurally incapable of removing the product. When incidents are forwarded to an external incident response tool, a command channel can send instructions back, but only after six independent checks pass: sender allow-list, HMAC token, message threading, a pre-authorizing rule, target binding and a single-use correlation ID. Reversible actions can run on their own; start, stop and restart always wait for human approval. Every configuration change and every database write leaves a read-only trail with the command and where it came from.
Yes. Observation and detection change nothing in your environment, and plenty of teams run at that level indefinitely. Automation capabilities are configured deliberately, and the actions that carry real consequence stay behind human approval even once they are enabled.
Reports your team can hand to the business. The Health Report gives rolling 7, 15 and 30-day averages per server, with a lifetime view, cleanup status and an advisor, exported as a self-contained HTML page. The Package Report tracks package build projects against their schedule and emails when one stalls. Server History produces a printable snapshot of any scope over a period. Job Monitor shows UBE history filtered by job, version, user, environment and queue, plus what is running right now with live CPU. Warning Events records non-urgent findings without alerting anyone. HTML and Excel exports are available on the screens that matter.
AlwaysOn audits its own behavior through thirteen internal checks in the AON family: SMTP off or failing silently, a group with no recipients, a master rule switched off, polling stalled, metrics gone stale, a license nearing expiration, or an auto-kill it could not verify. Those findings show up on the Always Health screen only, never by email, because a pendency about email must not depend on email to be seen.
Yes. An opt-in HTTPS console on its own separate port, enabled during installation and off by default, while the desktop backend stays on loopback at 127.0.0.1. Web sessions are multi-user and independent of the desktop, so a browser login never drops the desktop one. The same login rules apply: an Argon2 application password plus TOTP or email OTP.
Start with an AlwaysOn assessment. Fill in the form on this page, or talk to the NovaCon team, by email at info@novaconweb.com or by phone at +1 (646) 663-8667. We map your JD Edwards topology, the components in scope and the connections required, and show you what AlwaysOn would surface in your specific environment. Business hours are Monday through Friday, 9:00 AM to 6:00 PM EST, and we usually reply within 24 business hours.
Talk to a NovaCon specialist and see how AlwaysOn would fit your JD Edwards EnterpriseOne environment: the components in scope, the connections required, and what it would surface on day one.
Rather talk to NovaCon directly?
